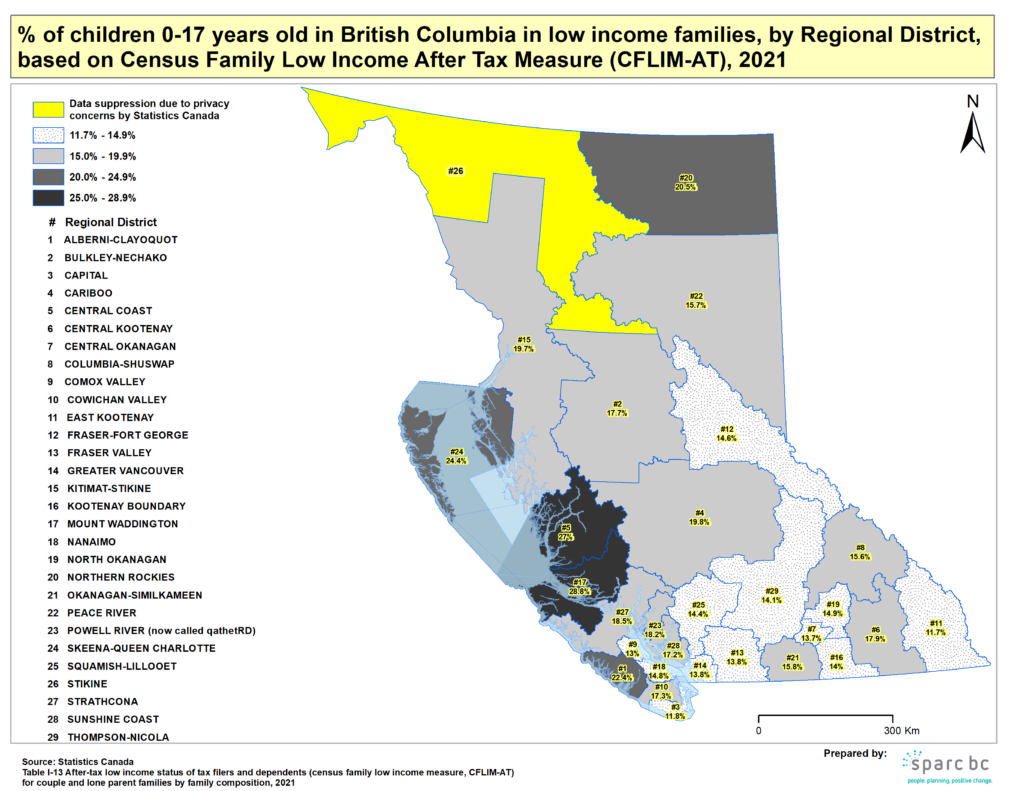
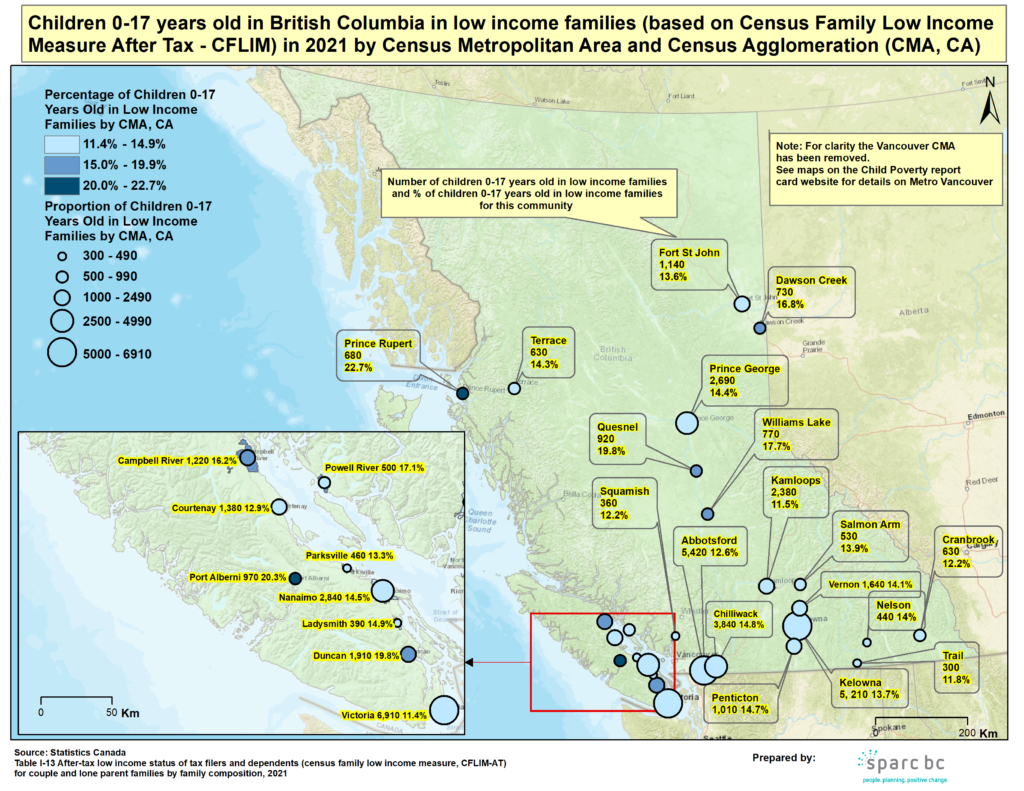
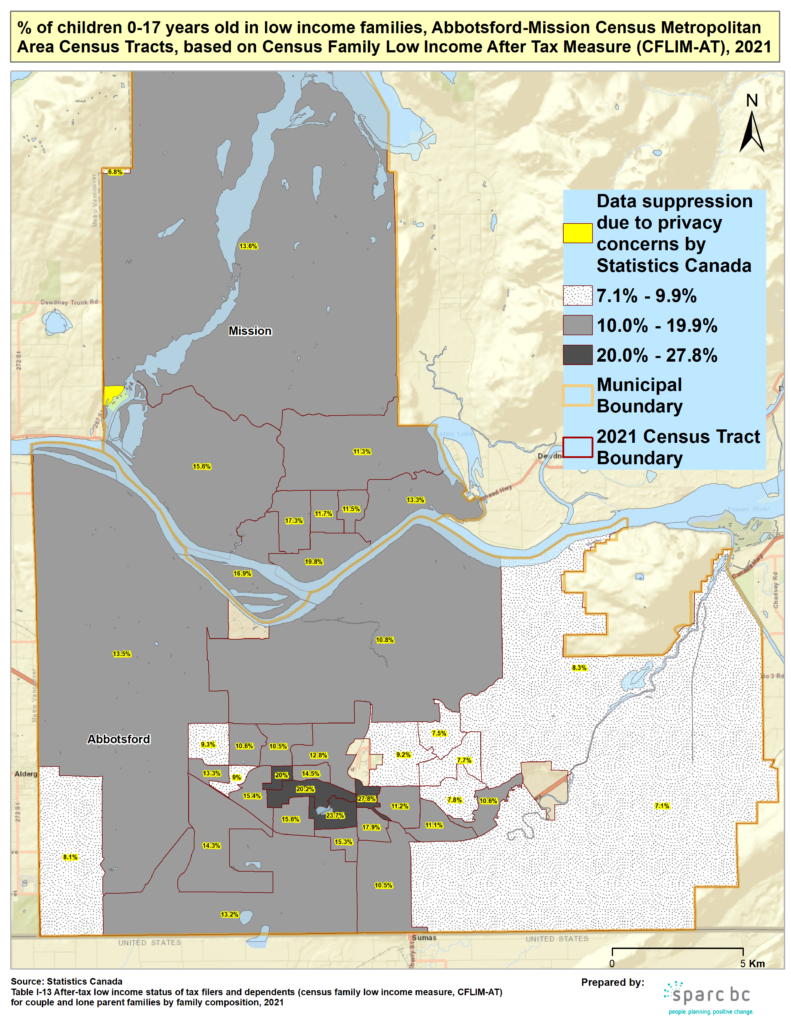
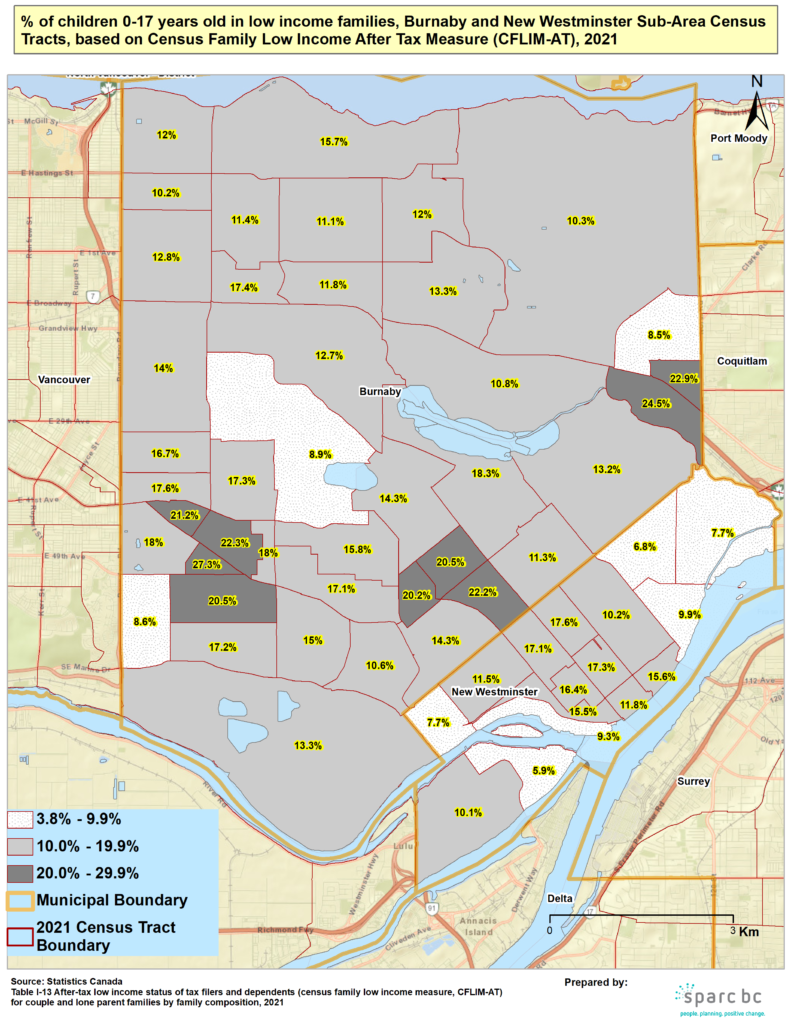
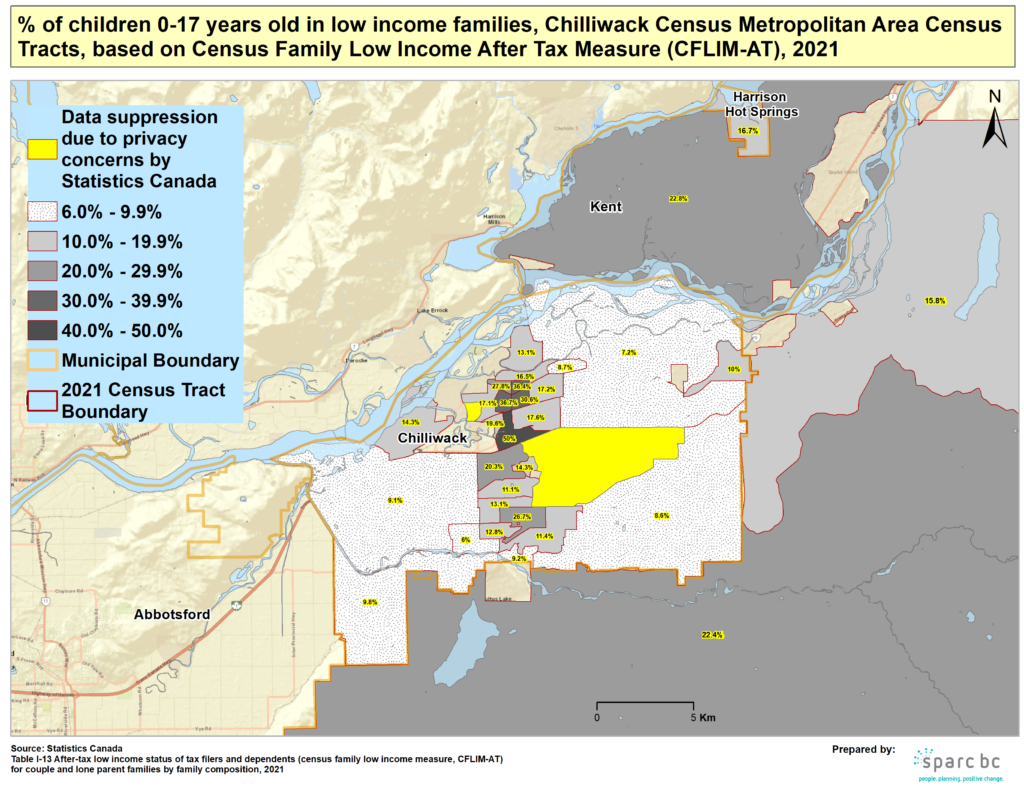
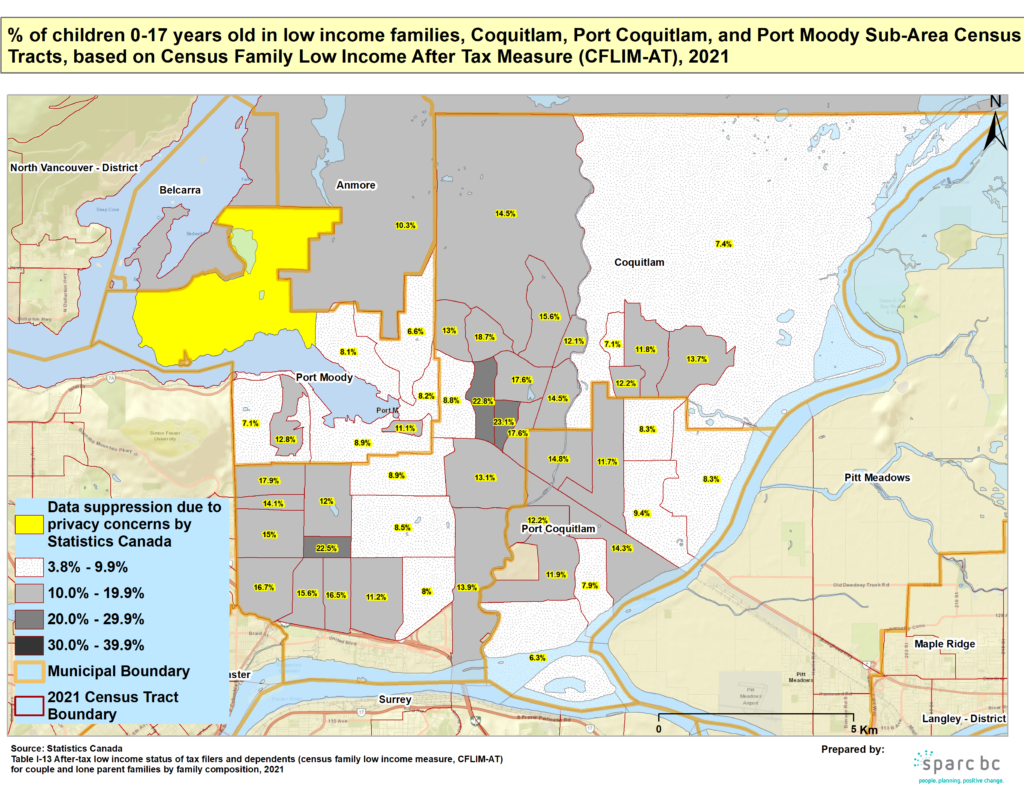
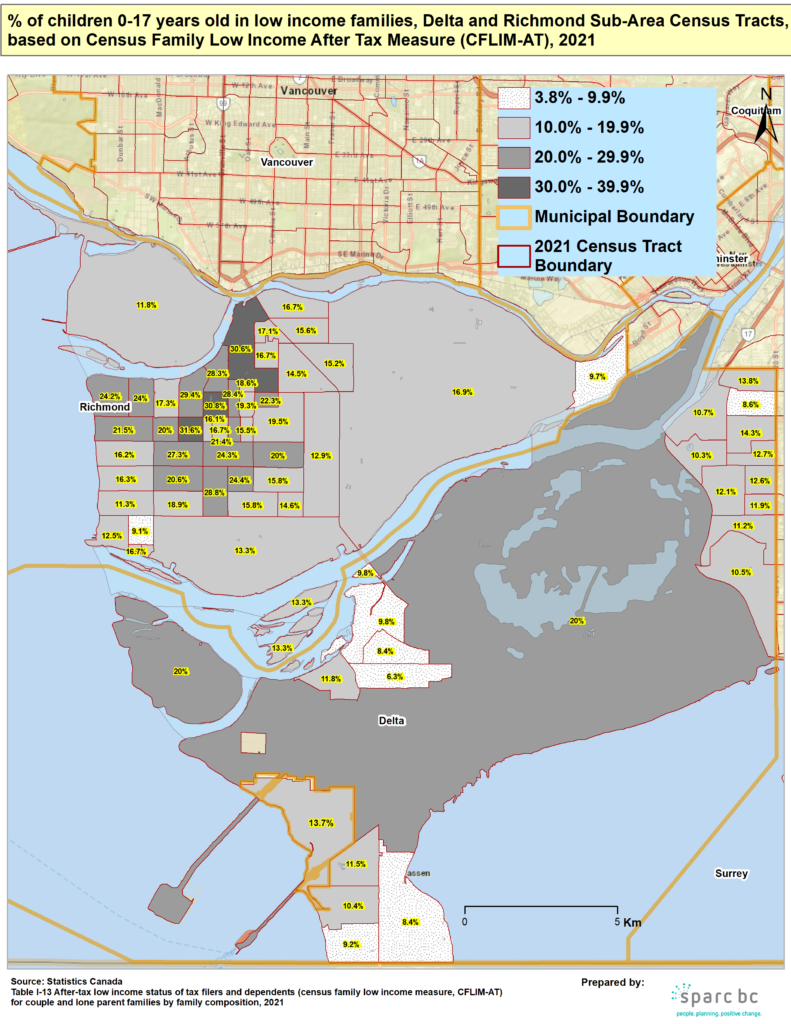
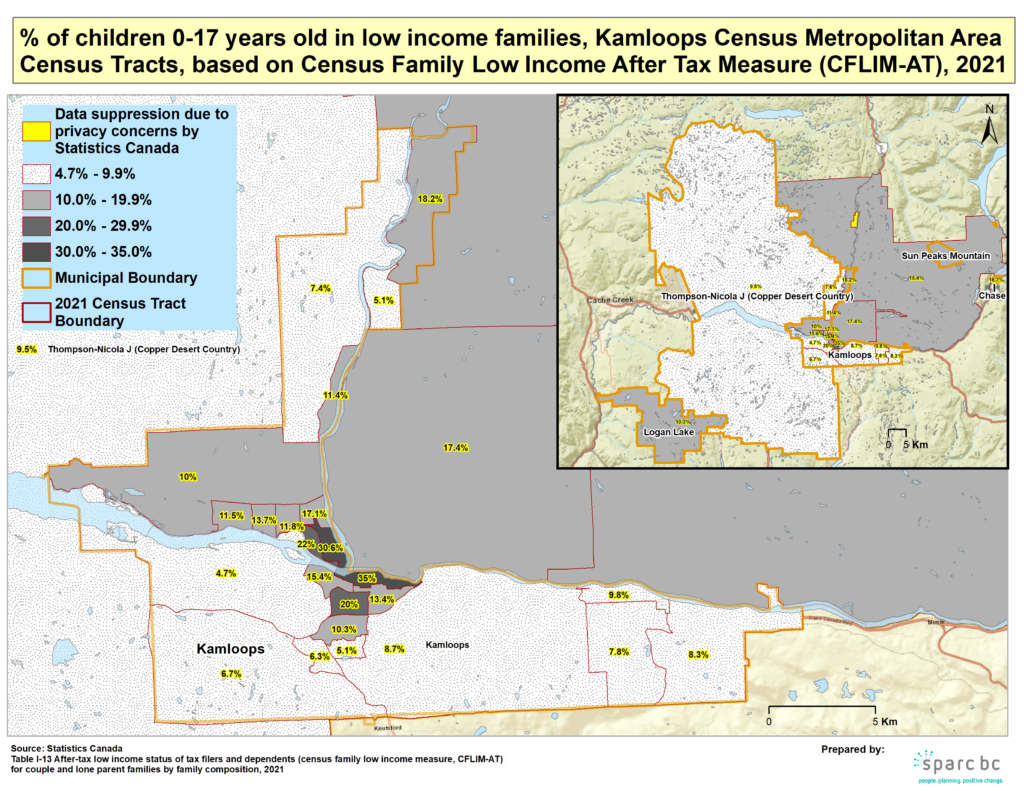
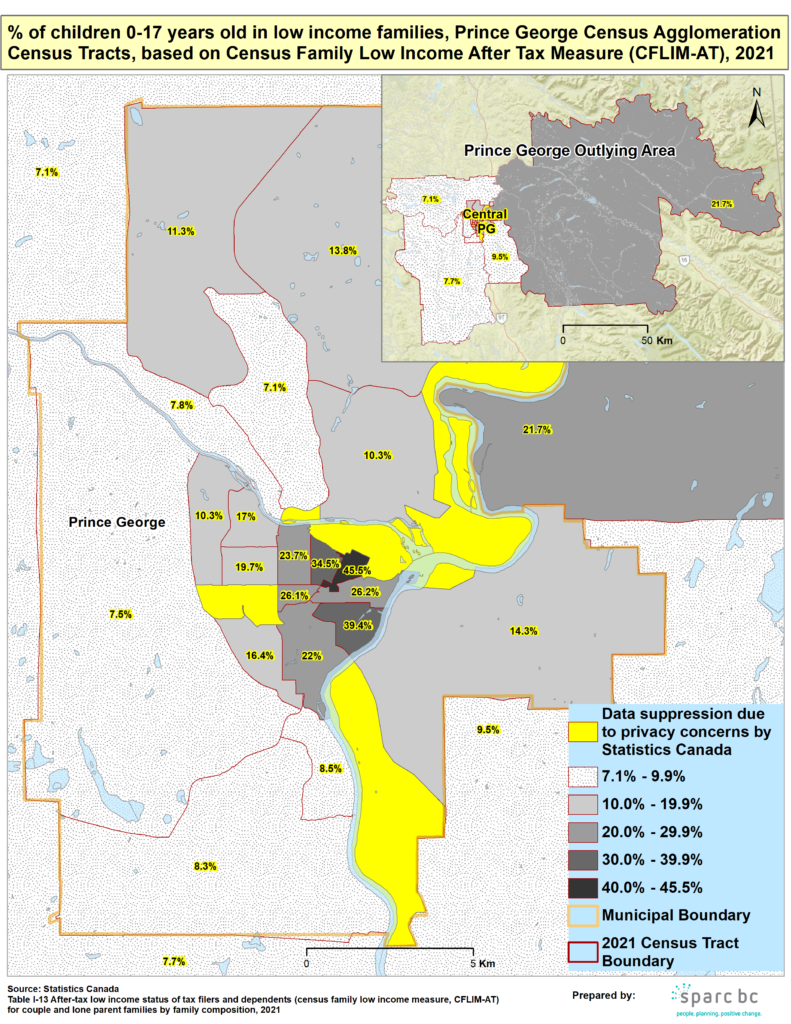
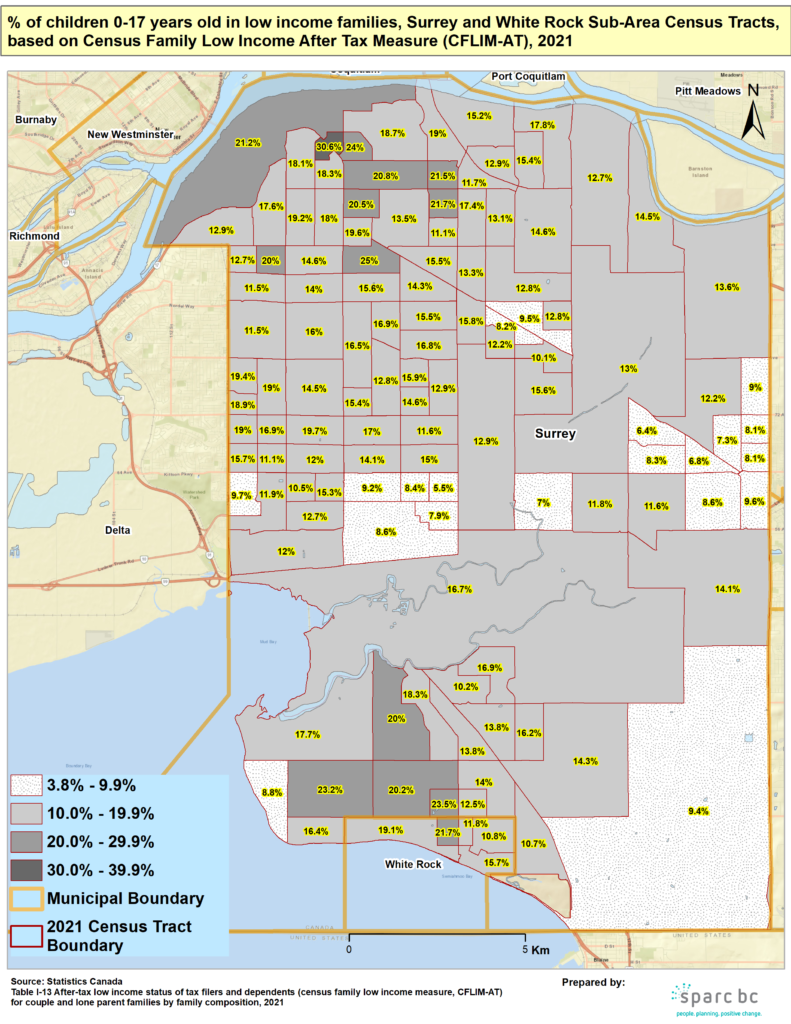
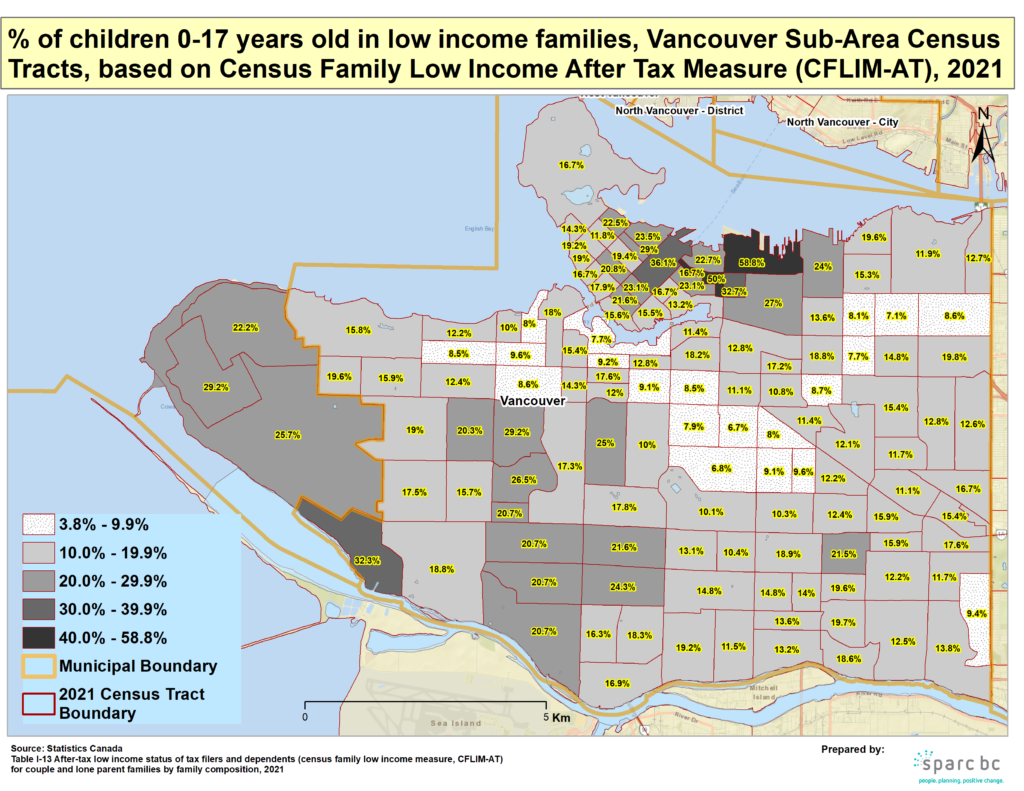
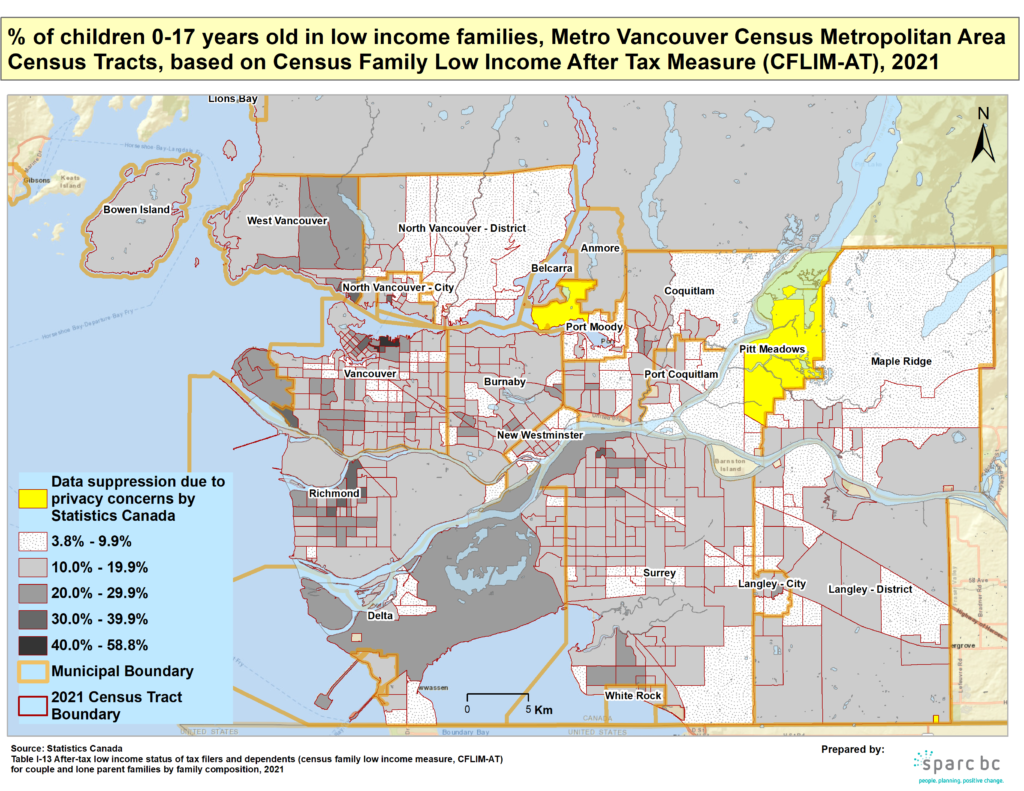
Child poverty across BC
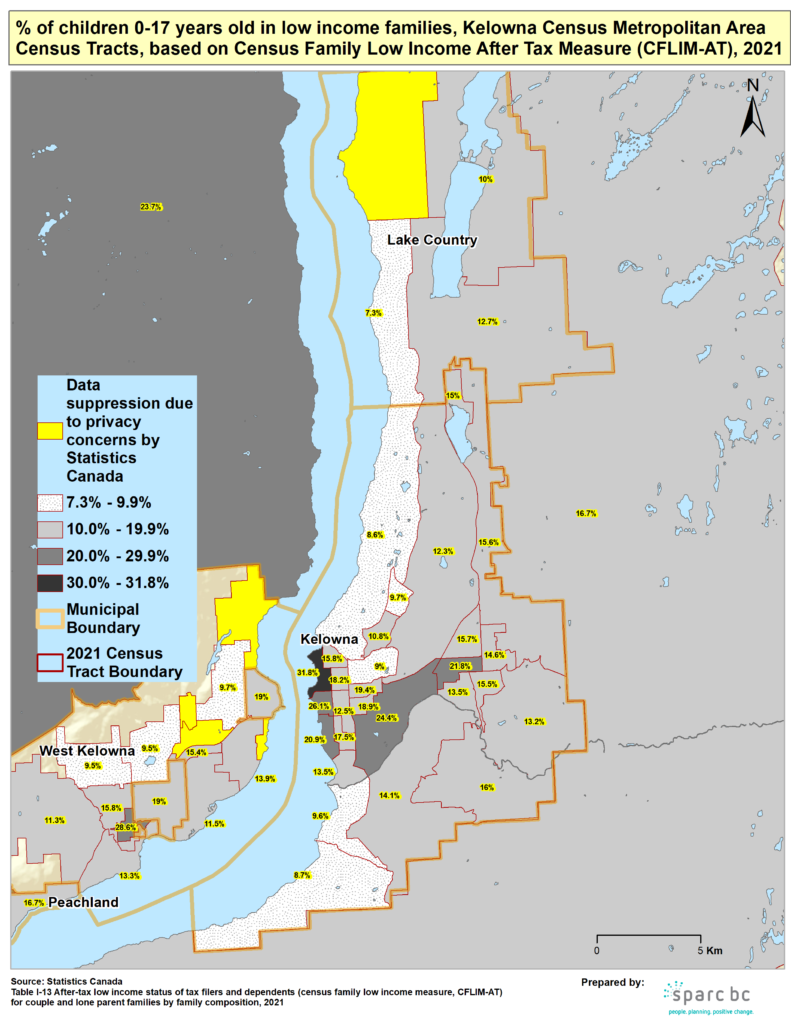
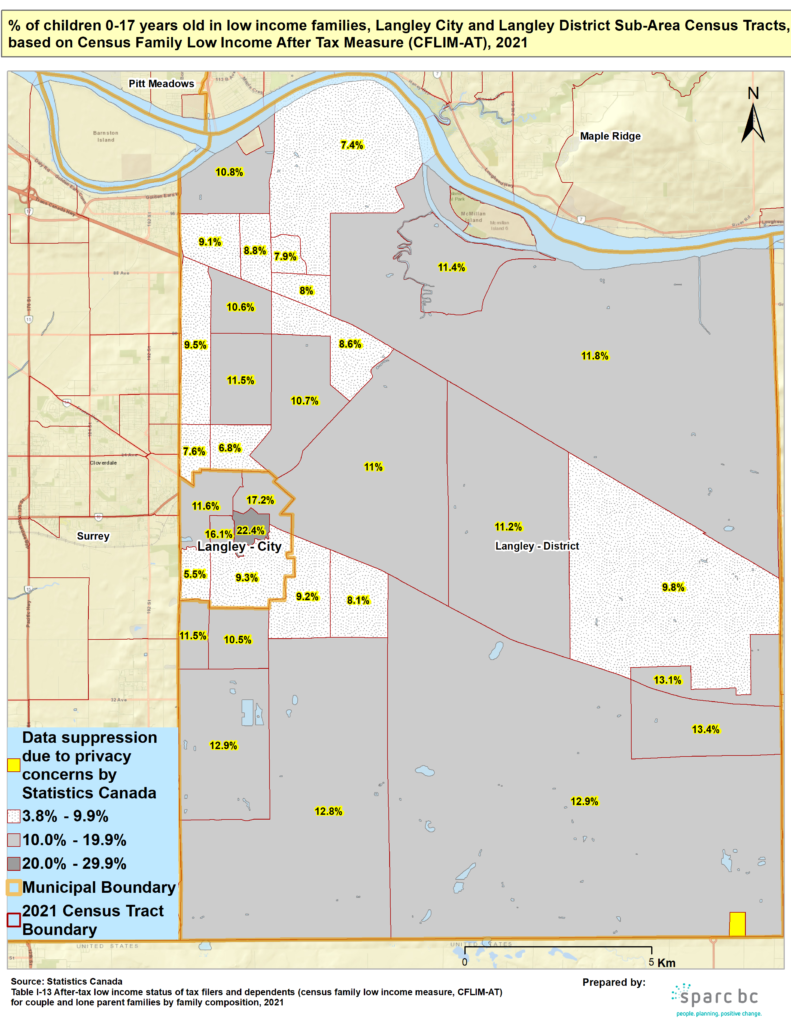
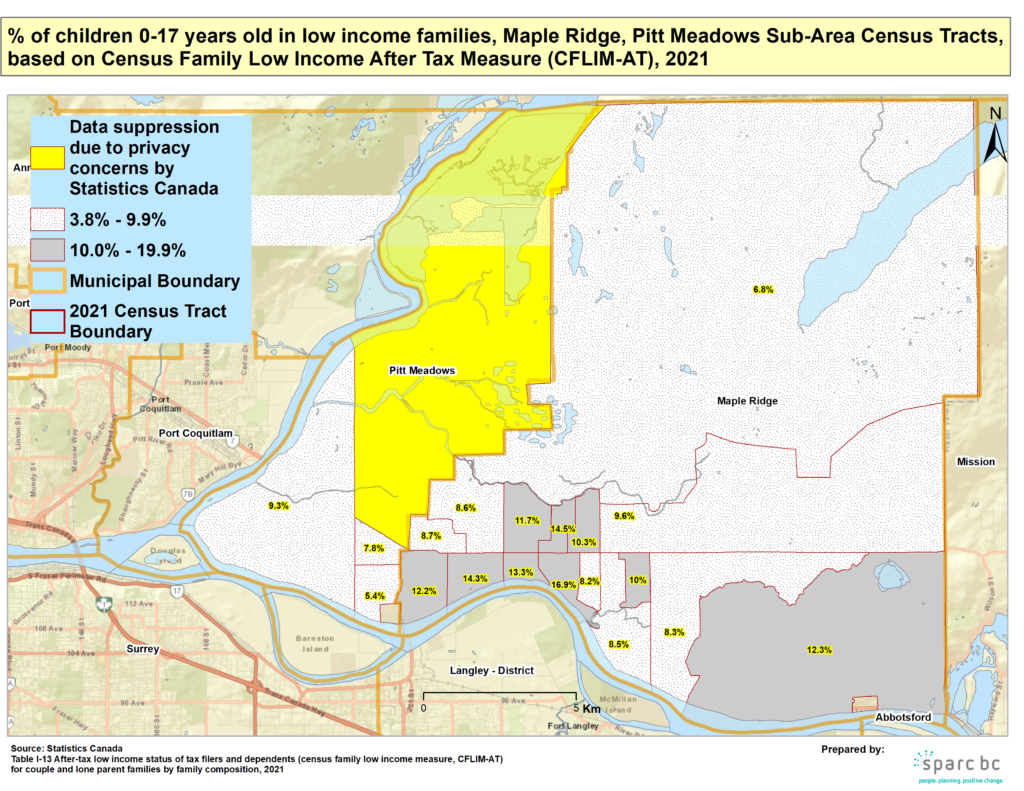
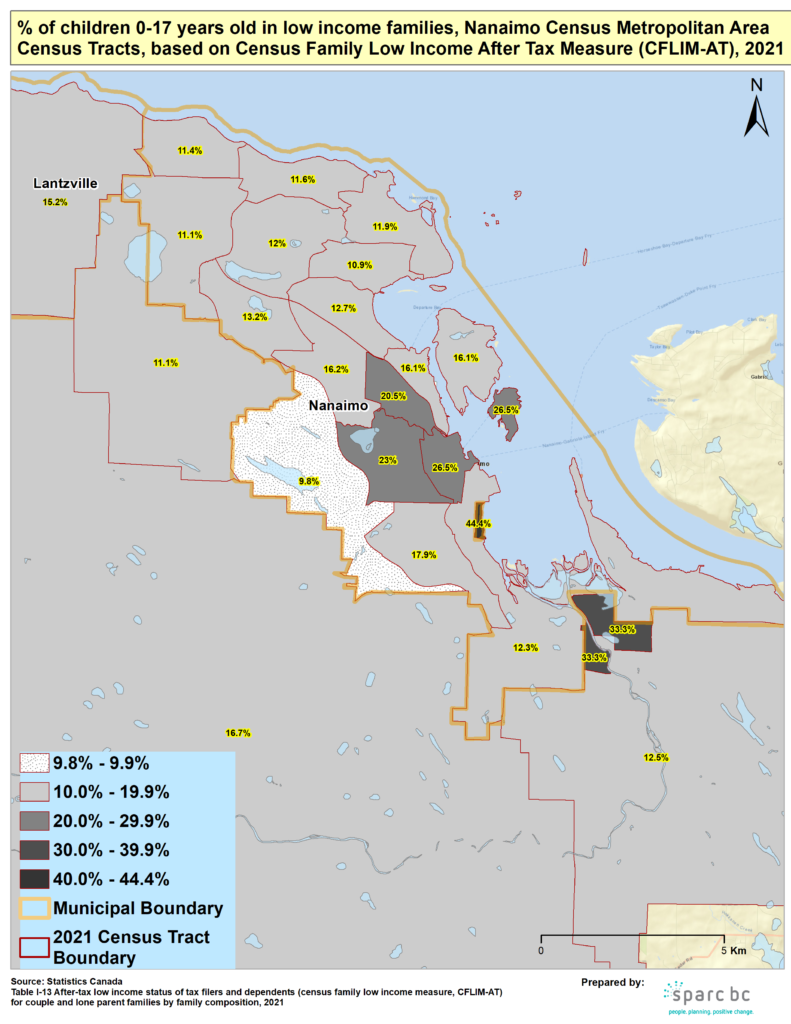
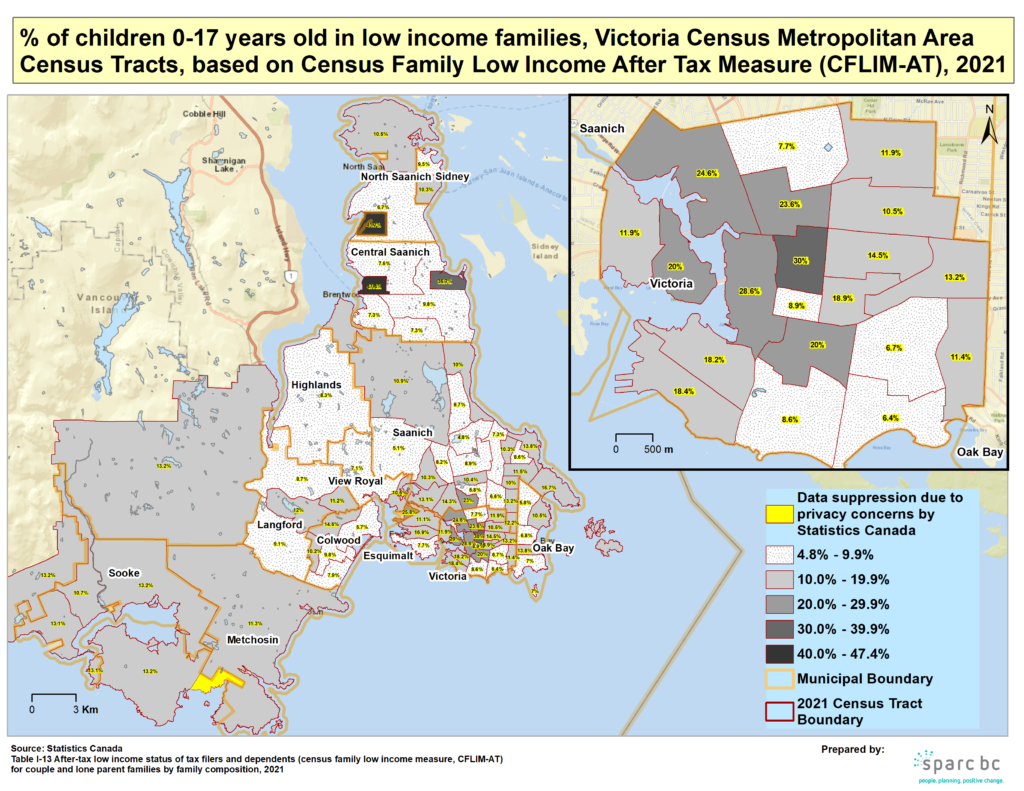
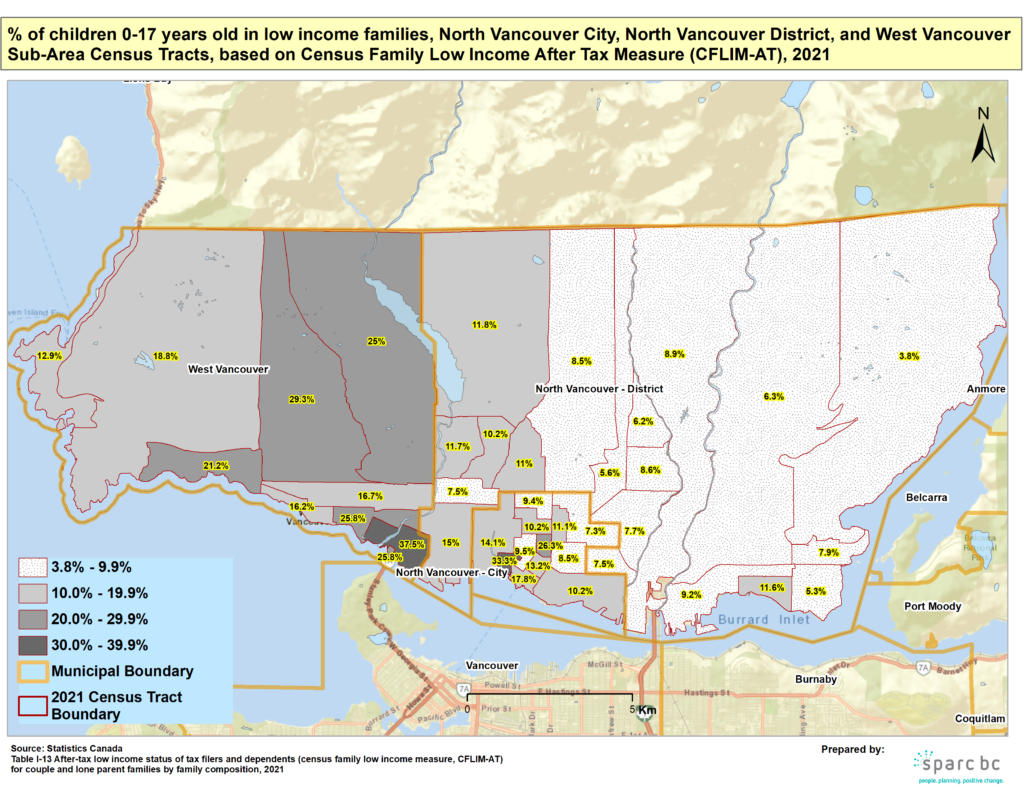
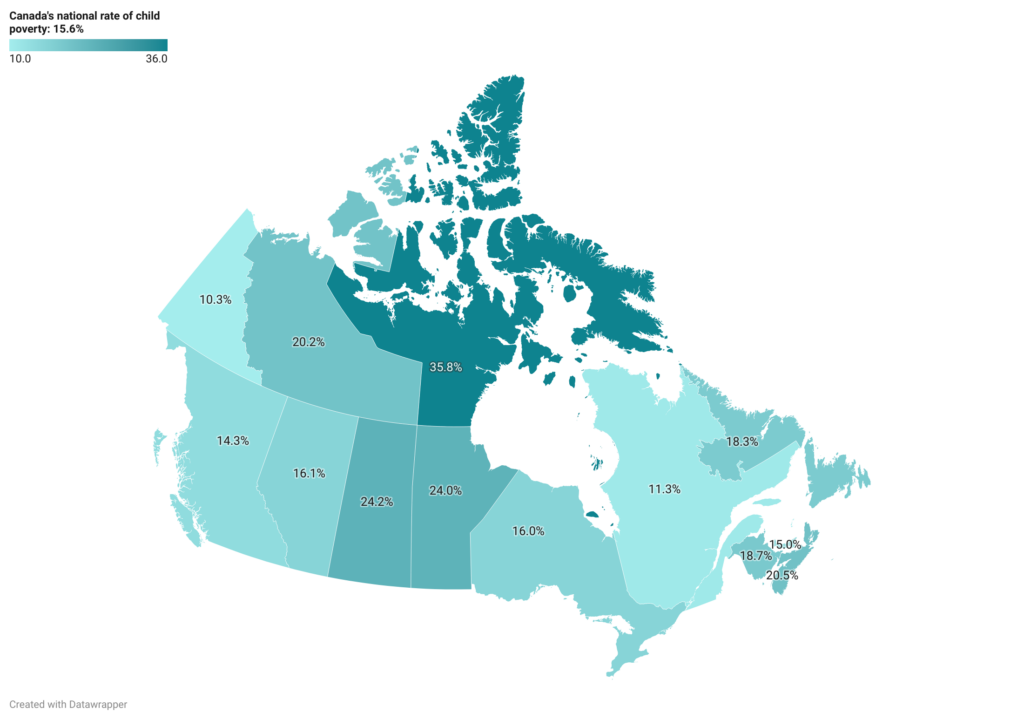
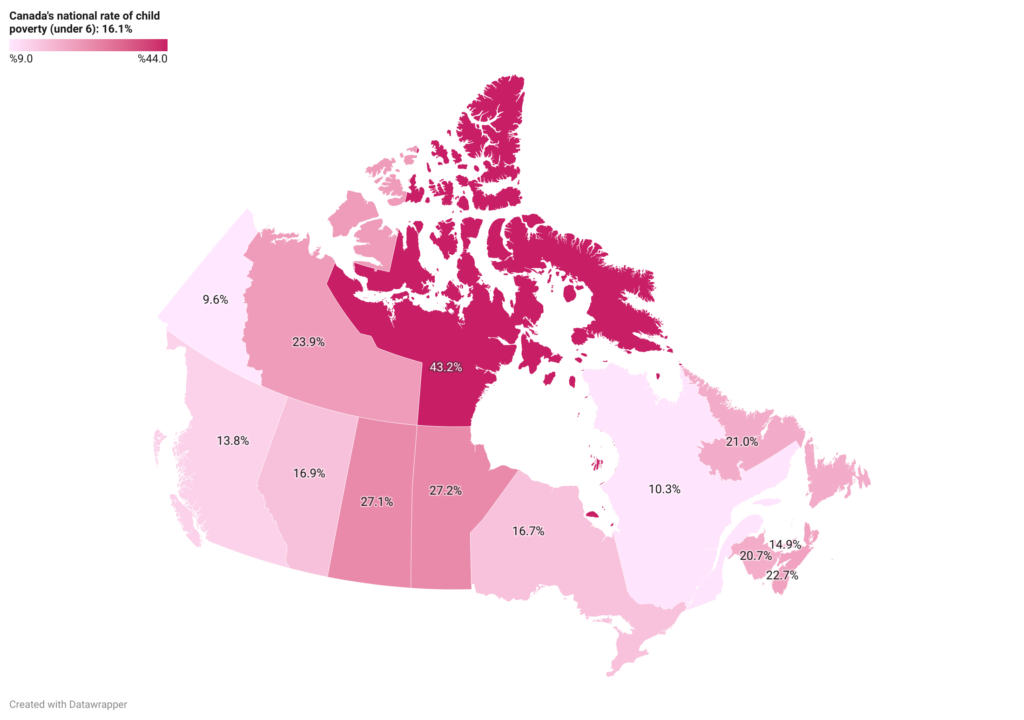
The following maps provide detailed information about child and family poverty across BC. The source data is Census Family Low Income Measure After Tax – CFLIM) in 2021 by Census Metropolitan Area and Census Agglomeration (CMA, CA).
Right click on map to open in a new tab.
![Regional Areas Map](https://i1.wp.com/firstcallbc.org/wp-content/uploads/2024/02/Regional_Areas_Map-1024x791.png?ssl=1)
![Urban Areas Map](https://i2.wp.com/firstcallbc.org/wp-content/uploads/2024/02/Urban_Areas_Map-1024x791.png?ssl=1)
![Abbotsfordmission Map](https://i0.wp.com/firstcallbc.org/wp-content/uploads/2024/02/AbbotsfordMission_Map-791x1024.png?ssl=1)
![Burnaby Newwest Map](https://i1.wp.com/firstcallbc.org/wp-content/uploads/2024/02/Burnaby_NewWest_Map-791x1024.png?ssl=1)
![Chilliwack Map](https://i2.wp.com/firstcallbc.org/wp-content/uploads/2024/02/Chilliwack_Map-1024x791.png?ssl=1)
![Coquitlam Port Moody Map](https://i1.wp.com/firstcallbc.org/wp-content/uploads/2024/02/Coquitlam_Port_Moody_Map-1024x791.png?ssl=1)
![Delta Richmond Map](https://i2.wp.com/firstcallbc.org/wp-content/uploads/2024/02/Delta_Richmond_Map-791x1024.png?ssl=1)
![Kamloops Map](https://i2.wp.com/firstcallbc.org/wp-content/uploads/2024/02/Kamloops_Map-1024x791.png?ssl=1)
![Kelowna Map](https://i0.wp.com/firstcallbc.org/wp-content/uploads/2024/02/Kelowna_Map-791x1024.png?ssl=1)
![Langley Map](https://i2.wp.com/firstcallbc.org/wp-content/uploads/2024/02/Langley_Map-791x1024.png?ssl=1)
![Maple Pitt Map](https://i0.wp.com/firstcallbc.org/wp-content/uploads/2024/02/Maple_Pitt_Map-1024x791.png?ssl=1)
![Nanaimo Map](https://i0.wp.com/firstcallbc.org/wp-content/uploads/2024/02/Nanaimo_Map-791x1024.png?ssl=1)
![Princegeorge Map](https://i0.wp.com/firstcallbc.org/wp-content/uploads/2024/02/PrinceGeorge_Map-791x1024.png?ssl=1)
![Surrey White Map](https://i1.wp.com/firstcallbc.org/wp-content/uploads/2024/02/Surrey_White_Map-791x1024.png?ssl=1)
![Vancouver Map](https://i1.wp.com/firstcallbc.org/wp-content/uploads/2024/02/Vancouver_Map-1024x791.png?ssl=1)
![Metro Vancouver Map](https://i0.wp.com/firstcallbc.org/wp-content/uploads/2024/02/Metro_Vancouver_Map-1024x791.png?ssl=1)
![Victoria Map](https://i2.wp.com/firstcallbc.org/wp-content/uploads/2024/02/Victoria_Map-1024x791.png?ssl=1)
![West North Vancouver Map](https://i1.wp.com/firstcallbc.org/wp-content/uploads/2024/02/West_North_Vancouver_Map-1024x791.png?ssl=1)
![Child Poverty Map 2 (canada’s National Rate)](https://i0.wp.com/firstcallbc.org/wp-content/uploads/2024/02/child-poverty-map-2-Canadas-national-rate--1024x720.png?ssl=1)
![Child Poverty Map 1(canada’s National Rate Under 6 Years Old)](https://i2.wp.com/firstcallbc.org/wp-content/uploads/2024/02/child-poverty-map-1Canadas-national-rate-under-6-years-old-1024x720.png?ssl=1)